
Add horses to the comparison#
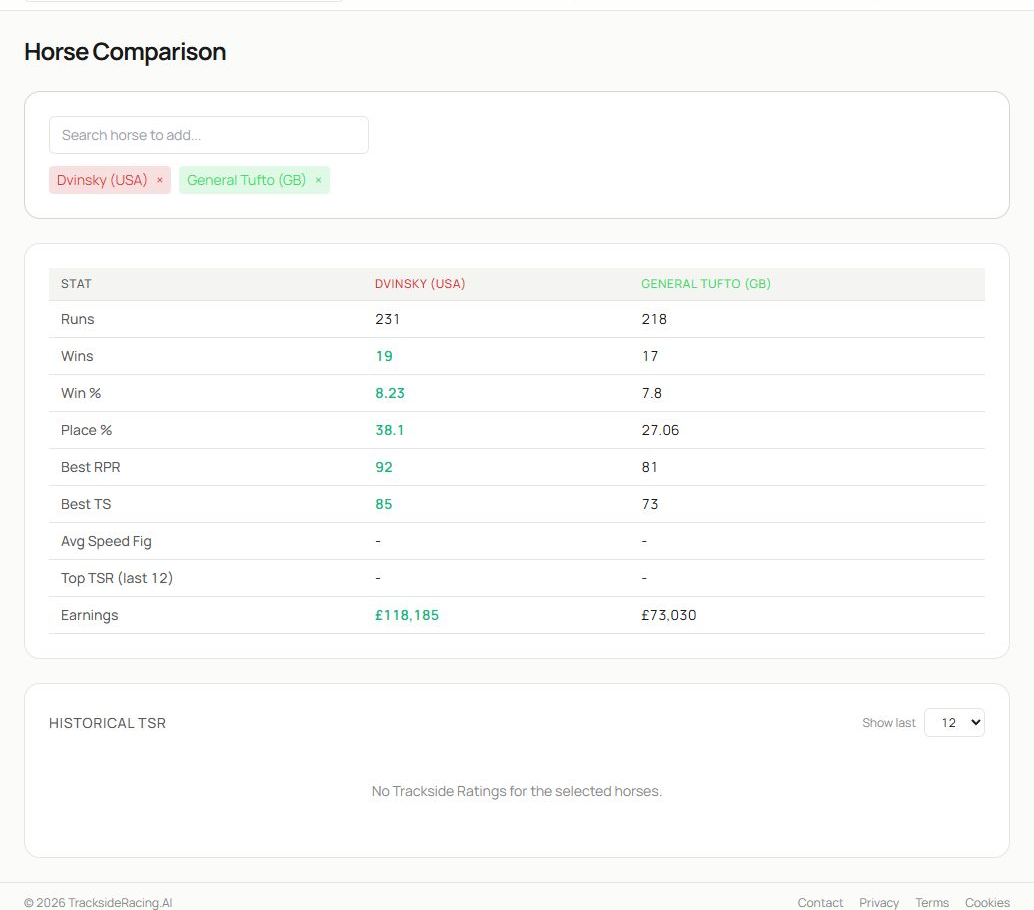
- Search for a horse and select it from the suggestions. Repeat to add the other horses you want to compare. Remove a selection with the small close control on its tag.
- The main table compares runs, wins, win percentage, place percentage, best RPR and other available statistics in consistent columns.
- Lower panels compare further values such as speed figures, earnings and historical TSR where ratings are available.
Names with country suffixes refer to distinct database records. Check that each selected horse is the intended one before reading the result.
Start from a race#
On a race detail page or expanded racecard, select Compare runners. This preselects the race context and reduces the chance of choosing the wrong horse. You can remove runners you do not need and add another horse for a broader benchmark.
Interpret the table#
Read across a single statistic to compare horses directly, then read down each horse’s column to understand the whole profile.
- Runs supply the sample-size context.
- Win and place percentages summarise outcomes but do not control for race difficulty or price.
- Best RPR records a peak, not the horse’s normal level.
- Earnings are influenced by jurisdiction, race class and opportunity.
- TSR is higher-is-better and appears only when supported ratings are available.
The comparison deliberately simplifies. Open each horse profile when a difference needs to be explained by going, class, distance, race type or recent form.
A useful comparison routine#
- Add only the genuine contenders or benchmark horses.
- Confirm identities and sample sizes.
- Compare consistency measures before peak measures.
- Check whether the apparent advantage fits today’s conditions.
- Open profiles or speed sheets for the two closest candidates.
- Return to the race and consider draw, pace and price.
If a ratings chart is empty#
Historical TSR is shown only where the required ratings exist for the selected horses. An empty chart is a data-availability state, not a rating of zero. Continue with the available summary statistics and profile records.
Related guides#
Use Horse Browser and Horse Profiles for condition splits and Speed Figures and Speed Sheets for the longer EAPF history.